Previous version of the QZFM Quick Start Guide Last Updated on July 6, 2017
Important: Information/Discussion Page please visit “Master Slave Configuration” and “Setting heater frequency for multi-channel operation” topics before running sensors.
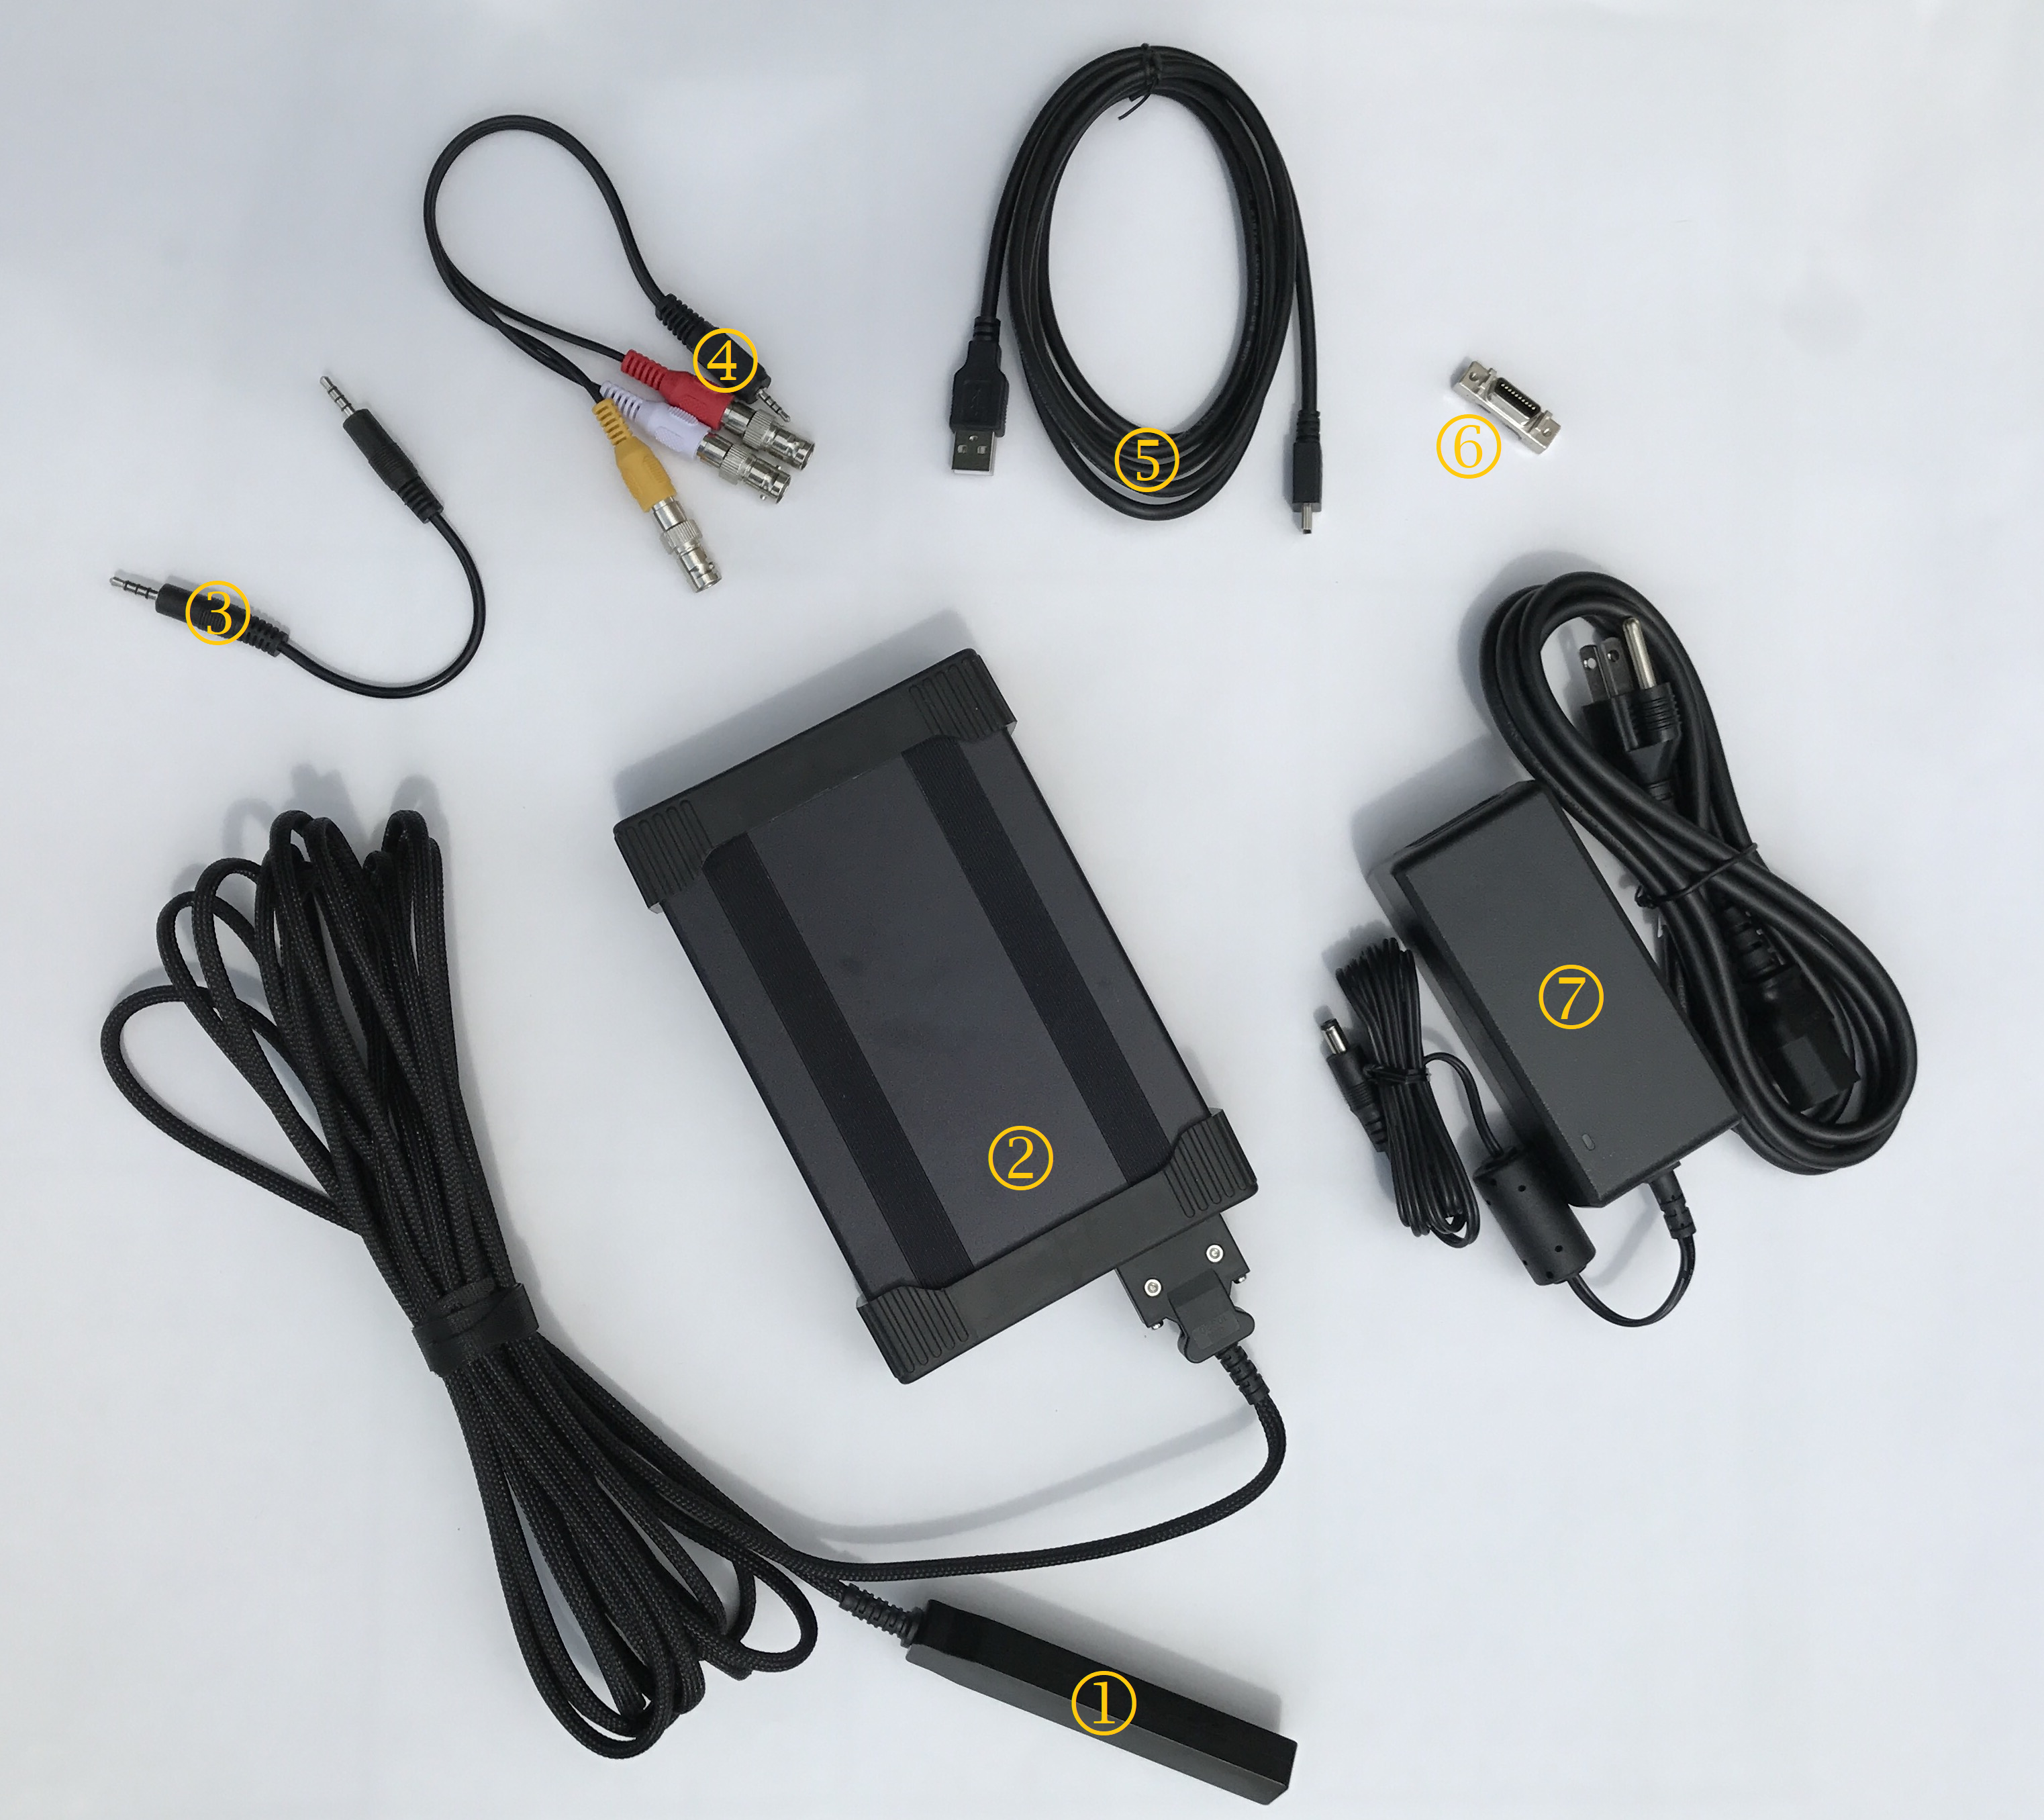
Figure 1: The QZFM package contains all the necessary hardware needed to run the sensors.
What’s in the box?
The QZFM package includes the following components (Figure 1):
- Sensor with 20 ft. cable
- Electronics Module
- Modulation cable – 3.5 mm to 3.5 mm audio cable (used only for multi-sensor operation)
- Analog output cable – 2.5 mm audio to 3-way BNC cable
- USB cable
- Shorting cap – For sensor cable connector to protect the laser when disconnected from the Electronics Module
- Power supply – 18V or 19V, 1 unit can power up to 6 sensors (using included cable splitter)
Hardware Setup
Step 1: Carefully remove the cables and the electronics module with attached sensor from the box.
- Warning: The sensor is highly sensitive to electrostatic discharge (ESD), so please take appropriate precautions (listed below) while disconnecting and reconnecting the sensor.
- Note : In the event the sensor cable has to be disconnected from the electronics module, ensure a well grounded environment and immediately attach the shorting cap ( in Figure 1) to the connector of the sensor cable and tighten the screws.
- Note: With multiple sensors, when reconnecting the sensor cables to the electronics module, check to ensure that the serial number of the sensor matches the serial number (SN) of the electronics module (located on both ends of the sensor as well as on the front and/or side of the electronics module).
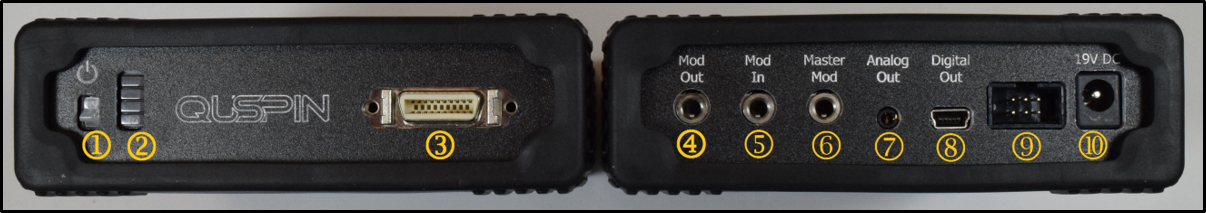
Figure 2: A picture of the front (left) and back (right) of the QZFM electronics module showing all the ports.
Step 2: Make sure the power switch (1) on all electronics modules is in the OFF (down) position before connecting the power supply to ’19 V DC’ (10). Note: The electronics module can operate with an 18V or 19V power supply.
Step 3: Connect the USB cable between the sensor (‘Digital Out’ port (8) on the electronics module) and the computer. A USB hub can be used for larger number of sensors.
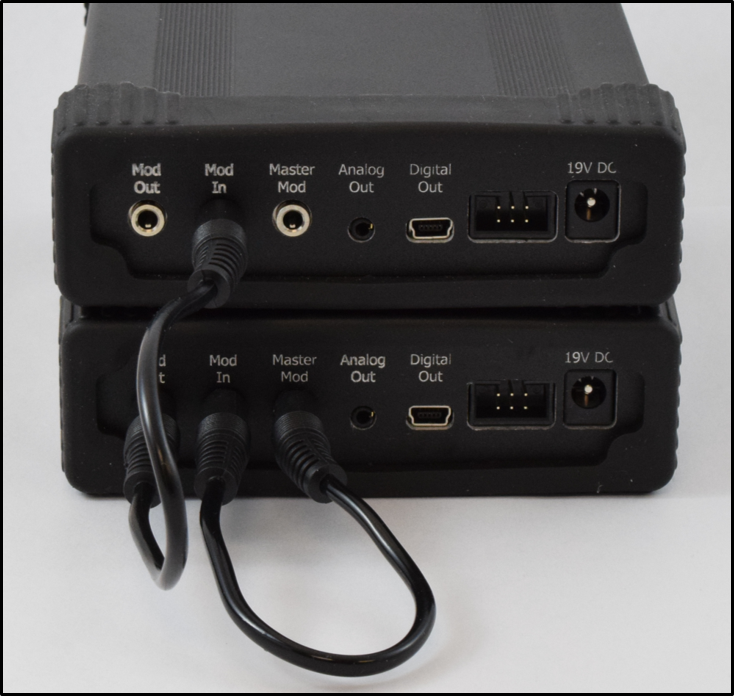
Figure 3: Connection of modulation cables for Master electronics (bottom) and a slave electronics (top).
Step 4: For multi-channel configurations, the modulation signal must be shared. Connect the modulation cables in the following configuration: For the Master electronics module, connect ‘Master Mod’ (6) to ‘Mod In’ (5) in Figure 2. Then connect the ‘Mod Out’ (4) from the Master, to the ‘Mod In’ (5) of a Slave electronics module. This can be repeated by connecting the ‘Mod Out’ of that Slave to the ‘Mod In’ of the next Slave until all electronics modules are receiving the Master modulation (See Figure 3).
Step 5: For monitoring or recording the analog output, connect the audio to BNC cable to the ‘Analog Out’ (7) of the electronics module to provide BNC connectivity. The red BNC is for the Z-axis signal and the white BNC is for the Y-axis signal (yellow BNC is not used).
Software Setup: Current Release
(Follow steps 1-3 to ensure full installation of the QZFM UI and dependencies)
1. Current UI: QuSpin ZFM UI V9.0.27
Previous Version: QuSpin ZFM UI V7.6.2
2. For first time installation it is recommended to download and run the QZFM UI v3.2 Installer.exe on a 64-bit PC with Windows 7 or later OS. This includes the installation of LabVIEW VISA drivers and the runtime engine (2014), other drivers, and the QZFM User Interface (UI) application.
3. The current release requires the LabVIEW 2015 (or later) 32-bit Runtime engine which can be downloaded on the National Instruments website at the link provided.
This video tutorial provides an overview of the QZFM UI functions and operation and applies to both the current and previous versions of the QZFM UI.
Quick demo of basic features of the updated UI:
Features:
LED Array:
The LED array at the top displays the last 4 digits of the sensor serial number above 5 LEDs corresponding to active-to-commands status (active sensors will receive commands), LED1 (laser on), LED2 (cell temp locked), LED3 (laser locked), LED4 (field zero complete). The LED array can be clicked on directly to display the sensor corresponding to the column that was clicked on at the top of the array in the “Sensors” tab.
Configuration File:
The location of this configuration file is “C:\QZFM Data\QZFM Configuration File.ini”. The file can be edited to change the order that the sensors are displayed in the UI and other parameters described in this video:
The configuration file can be deleted by pressing “Delete Sensor Configuration File” or opened by pressing “Open Sensor Configuration File”. If a previous configuration file exists the connection time will be minimal. If a configuration does not exist, the program will connect to the sensors and create a new configuration file for the next time the UI is opened.
Send Commands ALL ON/OFF:
This button will select and deselect which sensors will have commands sent to them. Make sure ON is displayed next to the name of the sensor to send commands to it, or that OFF is displayed if you do not want to send commands to that sensor.
Select Active Sensors:
The “Select Active Sensors” button allows for convenient selection of sensors to be active for recieving command, printing digital data to the charts, and firmware updates.
Print Buttons:
In the Sensors Tab click the corresponding “PRINT” button to the left of the sensor list to view digital data for that sensor in the Charts Tab. Alternatively you can select a sensor from the “Print Sensor” drop down menu in the Charts Tab, or press the “Print All ON”/”Print All OFF” buttons.
Display From:
This control will move the sensor list so that the Mag# displayed at the top of the list matches the number in the box.
Data Save:
This will record digital data from all sensors. Note: Digital data is printed asynchronously by each electronics module at 200 Hz (the start time and number of samples recorded will vary slightly for each sensor). Digital data is mainly intended for diagnotics purposes, it is recommended to record analog data with a 16-bit DAQ which allows the data to be recorded synchronously for all sensors.
Sensor Info Tab:
This tab allows individual sensors to be selected to read/write sensor specific parameters.
Sensor calibrations are displayed to the right of the corresponding serial number after calibration is run.
Diagnostics Tab:
If a sensor is not working properly it can be selected in the Diagnostics Tab and run through an automatic diagnostics routine. After the diagnostics routine is complete, a screenshot of the page and explanation of the problem can be sent to jo@quspin.com or info@quspin.com for further assistance.
Diagnostics example video:
Firmware Update Tab:
This tab is used to update the firmware of QZFM electronics modules. Refer to the Firmware Update Guide on our website and follow the UI prompts.
Firmware update video: (Note: only attempt firmware update after receiving specific instructions from someone at QuSpin)
Possible issues:
If sensor names are displayed with an empty box when the UI Ready LED turns on, press the Delete Sensor Configuration File button and restart or close and reopen the UI. If that does not fix it, unplug the USB cables connected to the sensor electronics and give them time to reconnect (~5-10 seconds) then reopen the UI.
To make sure all the sensors are connected properly to the computer, open the Device Manager and expand Ports (COM & LPT). Each sensor will display as USB Serial Port (COM#) if connected properly.
Software Previous Release (Not recommended, use latest version of the QZFM UI above)
Step 1: Download and run the QZFM UI v3.2 Installer.exe on a 64-bit PC with Windows 7 or later OS. Follow the standard instructions through the process, which includes the installation of LabVIEW VISA drivers and the runtime engine, other drivers, and the QZFM User Interface (UI) application.
Step 2: If connecting sensors to the QZFM UI for the first time, be sure to check that all sensors are connected to the computer via USB cables and all electronics modules are turned ON using the power switch on the front panel. Once the sensor serial numbers are all properly listed in the QZFM UI it will not matter if the electronics are powered ON before or after opening the UI.
Step 3: Run the QZFM UI through the Start menu or from the installation folder at c:\Program Files\QZFM UI\QZFM UI v3.2.exe.
Important Note: If the UI prompts for selecting the FTD2XX.dll, download the file here and add it to the QZFM UI folder.
Note: The UI may take up to a minute (5 to 10 seconds per sensor) to scan the hardware and locate the connected QZFM sensors the first time following installation or under certain conditions that are described in the next section.
Operating the Sensors
Once the QZFM UI is running, all sensor SNs, (1) in Figure 4, should appear along the right side of the ‘Sensors’ window next to the sensor number ‘M#’. If this is the first time running the QZFM UI on this computer, turn ON or power cycle the electronics module(s) OFF then back ON to observe that all four LEDs to the right of the Sensor list in the UI flash green/amber three times to indicate a successful startup (Note: power cycling can be done using Reboot button in the UI or power switch on front panel of electronics modules). The ‘Sensor Status’ field (2) will display “Ready” when startup is complete.
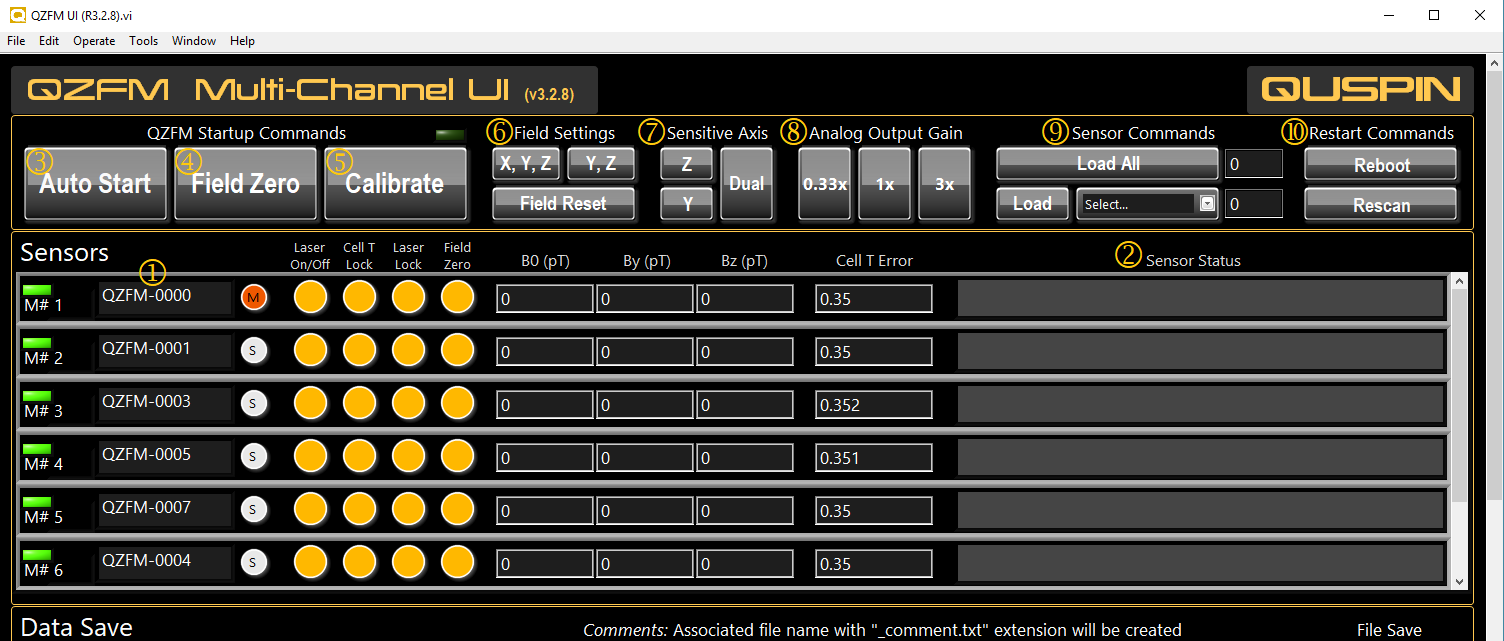
Figure 4: The top portion of the user interface for the QZFM contains all the buttons and indicators for starting, configuring, and monitoring the sensors.
Step 1: Press the [Auto Start] button (3) to bring the sensors online. The startup process takes a few minutes to complete, as indicated by the first three LEDs turning green. The ‘Laser On/Off LED’ will turn green to indicate that the laser is on. Next, the ‘Laser Lock’ LED will turn green when the laser frequency is locked. Finally, the ‘Cell T Lock’ LED will turn green when the vapor cell is at optimal temperature.
Step 2: Once the first three LEDs are green, press the [Field Zero] button (4) once to activate field zeroing. The button will turn amber color while active. When the field values for B0, By, and Bz stop fluctuating (to within a few 100 pT, usually taking between 5-10 seconds), press the [Field Zero] button a second time to stop the process and lock the compensation fields. The fourth LED turns green indicating the compensations fields are applied.
Note: It is necessary to repeat the [Field Zero] operation every time the ‘Sensitive Axis’ is switched to a different mode or the background field is expected to have changed significantly (e.g. opening and closing the shields, or moving the sensors).
Step 3: When all 4 LEDs are green, press the [Calibrate] button (5). Wait for calibration values to appear sequentially in each corresponding ‘Sensor Status’ box (this process takes a few seconds per sensor). Calibration values less than 1.5 are considered normal and indicate optimal performance. Calibration values above 1.5 indicate sub-optimal sensor performance, either due to large background field (> 50 nT), or a possible sensor issue.
At this point the sensors are ready for measurement.
Additional Controls
Field Settings (6): The [X,Y,Z] (default) and the [Y,Z] buttons set the active axes for the [Field Zero] function (4). The [Y,Z] mode is used only when X (B0) compensation is not needed. Note: The B0 value is the combined applied field value for X field compensation and internal optimization. The [Field Reset] button will set the applied field values to zero (displayed as -1).
Sensitive Axis (7): The [Z], [Y], and [Dual] buttons set the active measurement axis of the sensor. The default mode is single Z-axis and the [Dual] button activates both Y and Z. Note: When switching between measurement axes, it is necessary to re-run the [Field Zero] operation followed by [Calibrate].
Analog Output Gains (8): These buttons set the voltage gain of the ‘Analog Out’ port. The default [1x] setting corresponds to 2.7 V/nT, the [0.33x] to 0.9 V/nT, and [3x] to 8.1 V/nT.
Sensor Commands (9): Refer to the command list for numbers corresponding to specific commands. Type the number in the field to the right of the [Load All] button and press [Load All] to send a command to all connected sensors. Or alternatively, send a command to a specific sensor by selecting it in the drop down menu and typing the command number in that corresponding field and then pressing [Load].
Restart Commands (10): The [Reboot] button resets all electronics (similar to power cycling) and reloads the firmware defaults. The [Rescan] button is used to reinitialize the sensor list. Note: This button should be used ONLY if sensors are added to or removed from the system. The [Rescan] functions will prompt the user to confirm and reopen the UI, which clears the previous sensor list. Re-opening the UI without a prior list will initiate a scan for connected QZFM sensors, which will take approximately 30-90 seconds.
Data Save
The QZFM UI provides data saving functionality of the digital output at 200 Hz sampling rate. Simply set the folder path for the data files in the ‘File Path (Folder)’ (1) in Figure 5. To start saving data, press the [File Save] button (3) once to activate data recording (highlighted in red while active). To stop data recording, press the [File Save] button a second time. Any comments typed in the ‘Comments’ field (2) before stopping data recording will be saved along with the data in a separate file with the added file name extension ‘_comment.txt’. Data files with .lvm extensions are saved for each sensor (and the associated comment file) in the selected folder.
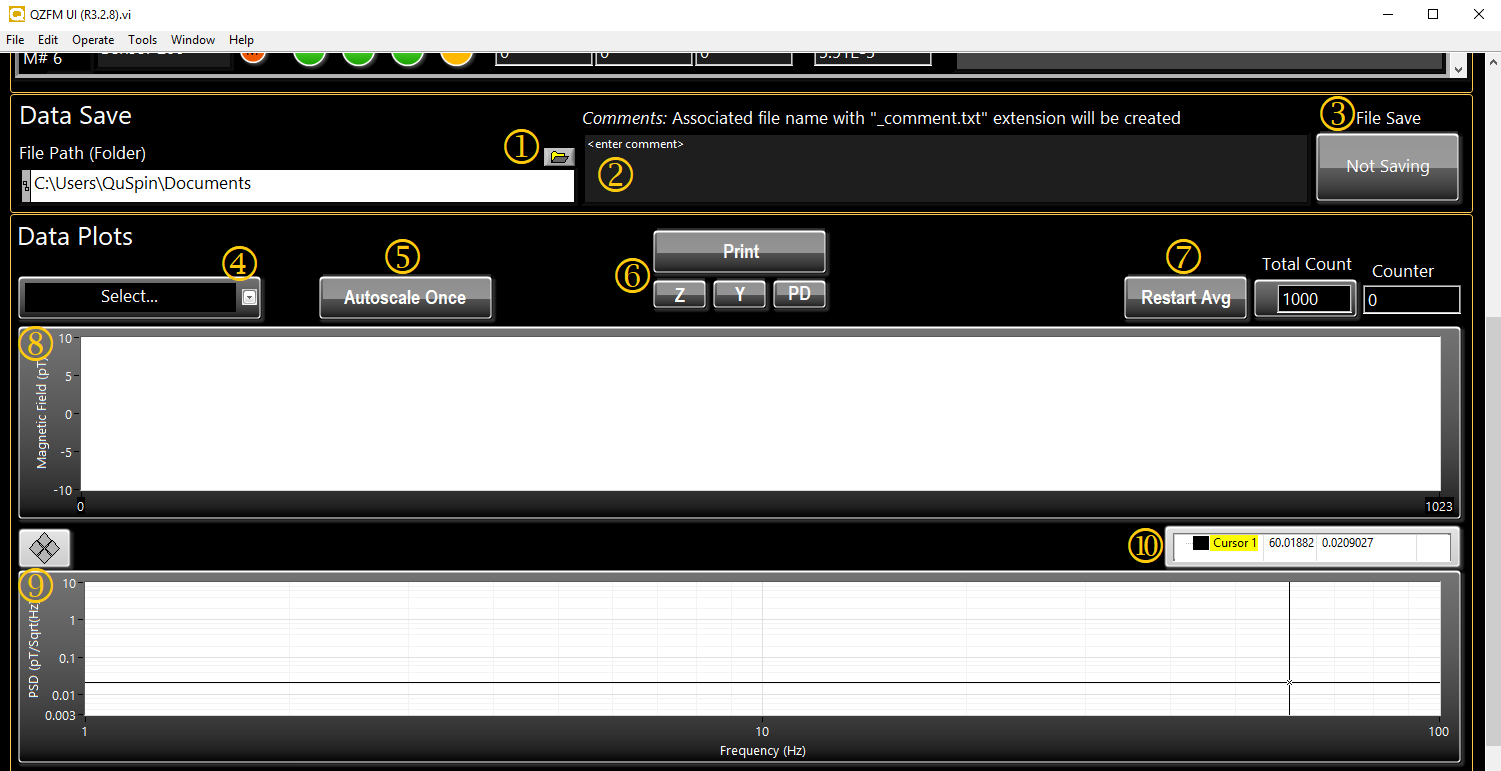
Figure 5: The Data Save section provides recording capability of the digital data stream for all connected sensors at 200 samples per second. For each recording session, all notes entered in the comments box will be saved along with the data in a separate text file at the time the recording period is stopped. The data section of the UI allows for the monitoring and plotting of data (time and spectral) for up to two selected sensor.
Data Plots
The drop-down bar (4) (in Figure 5) allows the user to select a sensor and display its output in the time series chart (8) and frequency spectrum graph (9). Press the [Print] button (6) (highlighted in amber while active) to start displaying the digital output of the selected sensor. Note: while the [Print] function is active, other sensor indicators such as the LEDs and Cell T Error will not update. Press [Autoscale Once] (5) to scale the Y-axis of the chart when needed. The [Z], [Y], and [PD] buttons (6) allow for selecting the displayed output of the Z axis, Y axis, or photodiode respectively. The [Restart Avg] button (7) will clear and restart the averaging for the spectral graph.