
UART Serial Communication (w/terminal emulator)
The QTFM Gen-2 utilizes a UART bus for communication. The easiest way to communicate is using a PC. The standard comms board comes with a USB-UART bridge (FT-234) and the advanced comms board comes with a Bluetooth-UART bridge (HC-05). Both create a virtual com port on the PC. A simple terminal emulator (such as Tera Term or minicom) can be used to receive and transmit data from QTFM. If the FTDI driver is not already installed (QTFM UI includes the drivers), they can be separately downloaded here. It is also possible to tap into the UART bus (Tx/Rx) directly on the standard and advanced COMs board to bypass the PC.
See also IMU fields are documented in full on the IMU guide. QuSpin’s updated docs merge these two pages; we keep both URLs because each is cited externally.
Serial port settings
| Baud rate | 115200 (default) |
| Data | 8 bit |
| Parity | none |
| Stop | 1 bit |
| Flow control | none |
| TTL Voltage | 0–3.3 V |
Terminal new-line
| Receive | CR |
| Transmit | CR+LF |
Data Format
Below is an example of the raw output data from the magnetometer.
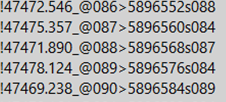
The digital stream is classified into three types, defined by the first character of each new line as described below:
| # | Sensor status and response messages |
| ! | Magnetometer digital data |
| )(+= | Ignore if the first character of a new line is not “!” and “#”. These delimiters are reserved for communication with our interface software. |
The example output above is raw magnetometer digital data because each new line begins with an “!”. Every line is terminated by carriage return and linefeed characters (\r \n).
Delimiter reference
Every delimiter the QTFM Gen‑2 can emit, in the order they appear on a line.
Magnetometer fields use symbols and uppercase letters; IMU fields use lowercase letters
— so X Y Z and x y z are different measurements.
| Delimiter | Field | Units / notes |
|---|---|---|
! | Scalar field |B| | nT, three decimals. Followed by a validity character. |
X Y Z | Vector field Bx, By, Bz | nT, three decimals. One axis per line. Followed by a validity character. |
@ | Data counter | 000–999, rolls over. |
> | Timestamp | Milliseconds since power-on, 32-bit. This is the measurement time base — it comes from the sensor’s own clock and is jitter-free. |
s | Scalar sensitivity | 000–999. Higher is better; 50+ is optimal. |
v | Vector sensitivity | 000–999. Higher is better; 10+ is optimal. |
a b c | IMU accelerometer X, Y, Z | All three axes on one line. |
i j k | IMU gyroscope X, Y, Z | All three axes on one line. |
x y z | IMU vector magnetometer X, Y, Z | Distinct from the QTFM vector add-on. All three axes on one line. |
t | IMU temperature | Single value. |
Which timestamp to use
The millisecond timestamp is the QTFM’s standard timestamp — the
> field above — and is what your time base should come from. It is generated by the sensor’s own clock, is jitter-free,
and is the only timestamp tied to when the field was actually measured.
If you are logging through a Magpie or an Advanced Comms Board, every line also carries a
microsecond timestamp added by the logger (us_ts, at the start
of the line). That one exists to correlate data with GPS time and to spot dropped samples.
It is not the measurement time base and should not be used as one. Mixing
the two up is the most common mistake we see in customer analysis.
Why the microsecond timestamp exists GPS data arrives asynchronously — the PPS edge does not line up with the sensor’s measurement pulses, so neither one can be timed by the other’s clock. The Magpie captures both on its own clock, which makes the microsecond timestamp the common reference that places a magnetometer sample relative to a PPS edge and so gives it an absolute UTC time. That is the job it does well. But it is not derived from the sensor, so use it to establish absolute time — not to measure the interval between samples. Intervals come from the millisecond timestamp.
Validity characters
| Character | Applies to | Meaning |
|---|---|---|
_ | Scalar |B| | Valid — no anomaly detected. |
* | Scalar |B| | Invalid — do not trust this point. |
= | Vector component | Valid. |
? | Vector component | Invalid. |
The four usual causes of invalid scalar data:
- The sensor is oriented in a dead zone.
- Excessive magnetic gradient.
- The background field is outside the operating range.
- The zero-crossing setting (SZC) is wrong for the environment — see sensor configuration.
Composition of the Magnetometer Digital Data
A breakdown of the QTFM G2 data string is shown below. The items that are streamed can be chosen by the user. In the example below, all print items are turned on.
!{Magdata}Y{Vectordata}@{Datacounter}>{Timestamp}s{Scalar Sensitivity}v{Vector Sensitivity}\r \n(Note: Vector data can begin with X, Y, or Z depending on the axis being printed.)
Example
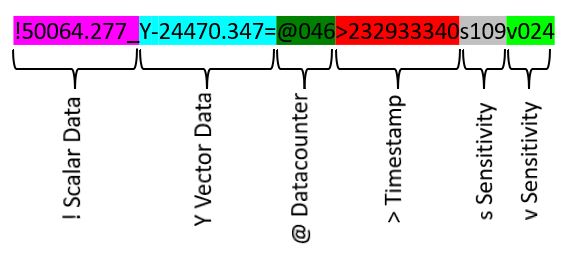
Magenta: Scalar magnetic field, |B|
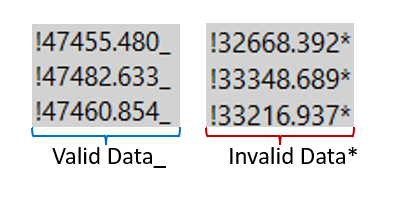
!50064.277_This component of the string gives the instantaneous value of the magnetic field, |B|, in nano Tesla (nT). The first character is !, followed by a number with three decimal digits (50064.277) which corresponds to the |B| field in nT. The |B| field value is followed by a validation character that is either _ or *.
If the validation character is _, the data is valid/reliable and no anomalies were detected. If the validation character is *, the data is likely invalid/unreliable. The most likely causes for invalid data are (i) the sensor is oriented in a dead zone, (ii) excessive gradient field, (iii) the background field is outside the operating range, or (iv) inappropriate setting for zero crossings (sZC).
Cyan: Vector Magnetic field — Bx, By, or Bz
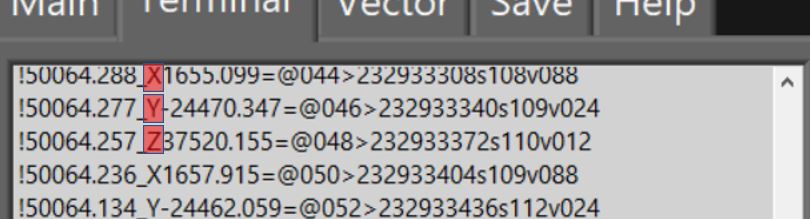
Y-24470.347=This component of the string gives the instantaneous value of one of the three components of the magnetic field, Bx, By, or Bz. The first character (delimiter) is either X, Y, or Z depending on the axis that is printed. In the above example, the magnetic field along the Y-axis is printed since data starts with a Y. The delimiter is followed by a number with three decimal digits (-24470.347). The number corresponds to the magnetic field along the associated vector component in nT. The value of the vector component is followed by a validation character that is either = or ?. If the validation character is =, the data is valid/reliable and the data is invalid/unreliable if the validation character is ?.
Note In any given data line, only one of the three vector components is printed. Therefore, the vector data rate is always 3x smaller than the scalar data rate. The data corresponding to the three separate axes is sequentially printed in three separate lines as seen below.
Blue-Green: Data counter
@046The data counter component of the string starts with @ and is followed by a three-digit number (0–999). The data counter rolls over and restarts counting from 0 once the counter exceeds 999. The data counter increments by +1 each time a magnetometer data point is streamed (independent of the data rate). The purpose of the data counter is to help monitor any data drops between QTFM transmission and the host receiver. For example, a counter value difference >1 for two consecutive data points indicates dropped data (except in the case of roll-over which happens at 999).
Red: Timestamp
>232933340The timestamp component of the string starts with > and is followed by a 32-bit number (0 to 4294967295). The 32-bit number represents time in milliseconds (ms) since QTFM is powered on. The counter rolls over roughly every 50 days (232/(1000*3600*24) days).
Grey: Scalar Sensitivity indicator
s109The scalar sensitivity component of the string starts with s and is followed by a three-digit number (0 to 999). The scalar sensitivity number, as the name suggests, is proportional to the magnetometer sensitivity in scalar mode (|B|). A higher sensitivity number implies the magnetometer is intrinsically more sensitive (50+ is optimal). Many factors affect this value but the two main ones are (i) sensor orientation with respect to the dead zone (sensitivity drops with increasing proximity to the dead zone), and (ii) zero-crossing (sZC) setting.
Green: Vector Sensitivity indicator
v024The vector sensitivity component of the string starts with v and is followed by a three-digit number (0 to 999). The vector sensitivity number is proportional to the sensitivity of the vector component printed in the same line. A higher sensitivity number implies the magnetometer is intrinsically more sensitive in the corresponding vector component (10+ is optimal). Many factors affect this value but the two main ones are (i) sensor orientation with respect to the dead zone (sensitivity drops with increasing proximity to the dead zone), and (ii) zero-crossing (vZC) setting.
Choosing print items
The user has complete control over what information is printed with each mag data point. The Data Counter, Timestamp, and Sensitivity prints can all be toggled on or off. This can be done using our interface with the print items control, or by sending ASCII commands (see the list of commands).
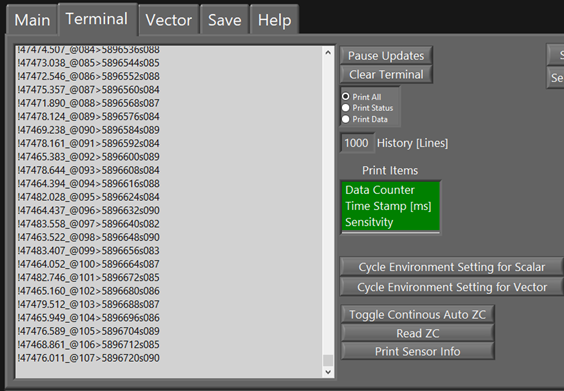
If you are only interested in the sensitivity indicator you may deselect the Data count and time stamps prints. See below.
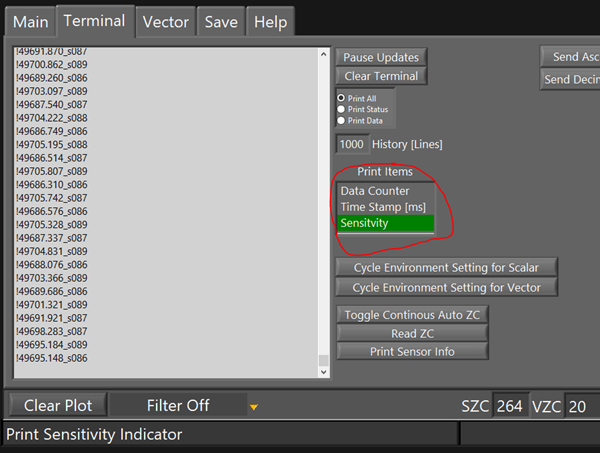
When a print item is toggled on or off it will preserve this setting. So even if the sensor is disconnected and powered off it will still have the same print format the next time it is powered on. A list of all the configurable settings that can be preserved can be found in the Configure sensor section.
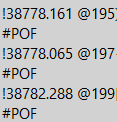
#POF error message This represents a print overflow. This error occurs when the sensor attempts to print a string before the previous string has finished printing. If you get this error continuously, too many items are being printed for the given data rate/baud rate. This will lead to data drops. To escape this error you have three options: reduce the print items, slow down the data rate, or increase the baud rate of the sensor. Once you do this you will see the #POF error message stop printing. The #POF error message must not be printing continuously once you have configured your sensor.