Wear
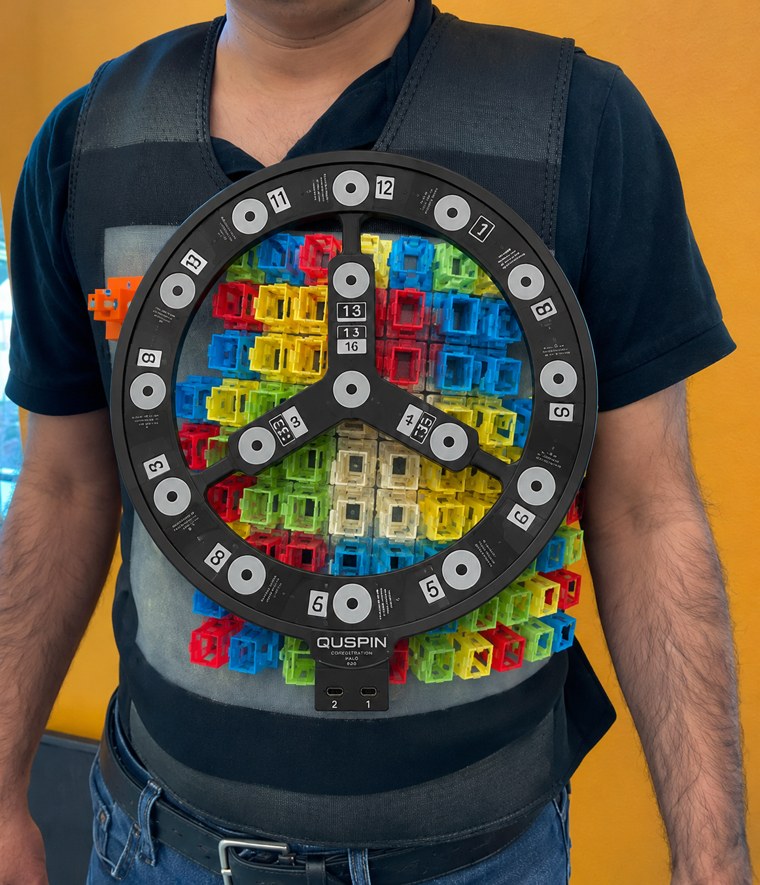
Clipped over the sensor vest, the HALO fires its 16 coils, each producing a known magnetic field — and every sensor in the grid beneath detects every pulse.

How a vest of optically pumped magnetometers mapped the heart’s magnetic field from a single heartbeat, without cryogenics and without contact with the skin.
Every heartbeat produces a magnetic field that is measurable outside the body.
Magnetocardiography (MCG) is the measurement of that field. In a proof-of-concept study on a healthy adult volunteer, QuSpin mapped it across the chest with a wearable vest of optically pumped magnetometers, using a co-registration system to determine where each sensor sat.
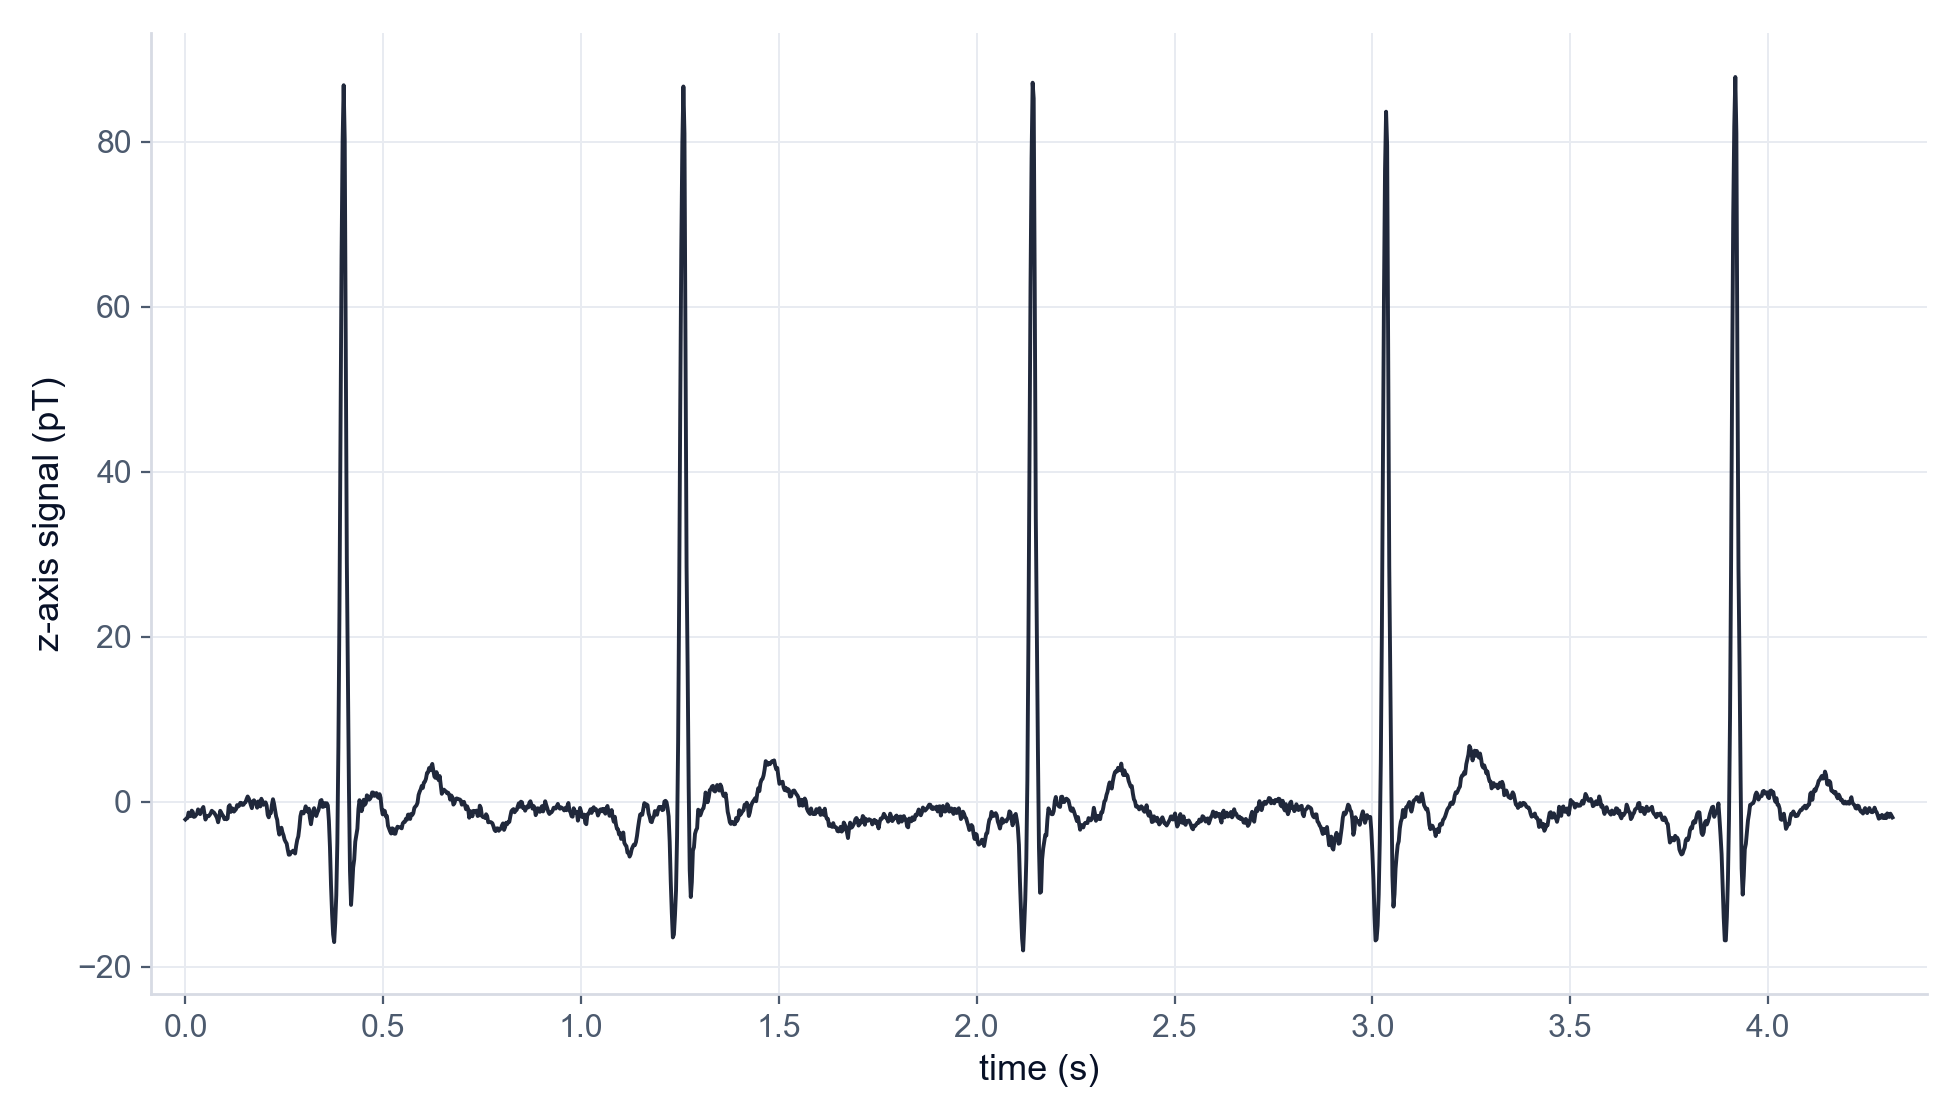
Each heartbeat is an electrical event. A wave of depolarization sweeps through the heart muscle, triggers the contraction, and then reverses as the muscle recharges for the next beat. An electrocardiogram (ECG) picks up the voltages this activity produces at the skin — the familiar spiky trace, whose tall R-wave marks the main contraction and whose rounded T-wave marks the recovery.
The same currents also generate a magnetic field, and that field carries complementary information. Unlike voltages, which are smeared and distorted as they conduct through lungs, muscle, and skin, magnetic fields pass through the body essentially unperturbed. They can also be measured without contact, so no electrodes or skin preparation are needed. Magnetocardiography records this field at many points over the chest at once, preserving spatial detail about where in the heart the currents flow.
The heart’s field peaks around 100 picotesla at the chest, about half a million times weaker than Earth’s steady field. Recording it requires very sensitive magnetometers and a magnetically shielded room to suppress ambient interference.
For decades the only magnetometers sensitive enough for MCG were SQUIDs, which must be cooled with liquid helium. The sensors sit inside a rigid, cryogenic dewar, the patient is positioned under a fixed sensor bed, and the whole installation occupies a heavily shielded room. The approach works, but the installation is large and expensive, and its fixed geometry cannot adapt to individual patients.
Optically pumped magnetometers (OPMs) such as the QuSpin QZFM reach comparable sensitivity — a noise floor below 15 fT/√Hz — from a sensor the size of a domino, with no cryogenic cooling. Because the sensors are small and self-contained, they can be placed directly against the chest, where the field is strongest, and arranged to follow each person’s body.
For this study — part of an NIH-funded research program to develop a next-generation MCG imaging system — QuSpin glued a grid of sensor holders onto an ordinary compression vest. It is deliberately a rapid research prototype, built to answer a feasibility question rather than to look like a product. When worn, the vest pulls every sensor snugly against the chest, and each holder accepts a triaxial OPM that measures the field along three axes at once. A wearable array also permits arrangements a fixed system does not: sensor layouts tailored to a patient, recordings taken sitting upright, and more compact shielding built around the person rather than a room built around a dewar.
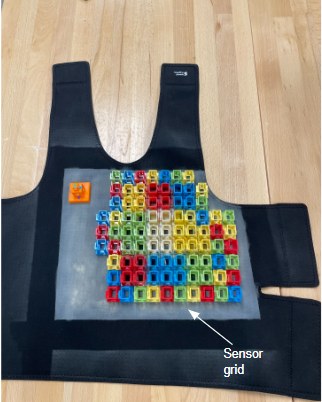
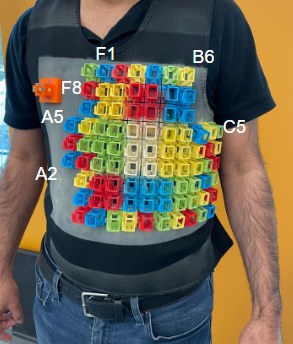
A flexible vest creates a problem a rigid dewar never had: the sensors land in different positions every time the vest is worn, and on every different chest. Turning 192 separate recordings into a coherent map of the heart’s field — and eventually into the location of the currents that produced it — requires knowing each sensor’s position and orientation to millimeters.
QuSpin addresses this with the HALO, a ring-shaped circuit board carrying 16 small coils at precisely known positions. Clipped to the vest, the HALO drives each coil in turn with a known current, producing a known magnetic field. Every sensor records every coil, and an optimization algorithm works backwards from those responses to solve where each sensor must be and which way its axes point. The full cycle — data collection to result — takes minutes, and in validation tests most sensors localize to within 2–5 mm, all within 1 cm.
The last step ties the sensor array to the person. A smartphone photogrammetry app builds a 3D model of the subject in the vest, and the HALO’s coil positions serve as fiducial markers to register the solved sensor locations into the subject’s own coordinate system — the frame that matters for interpreting the data anatomically.
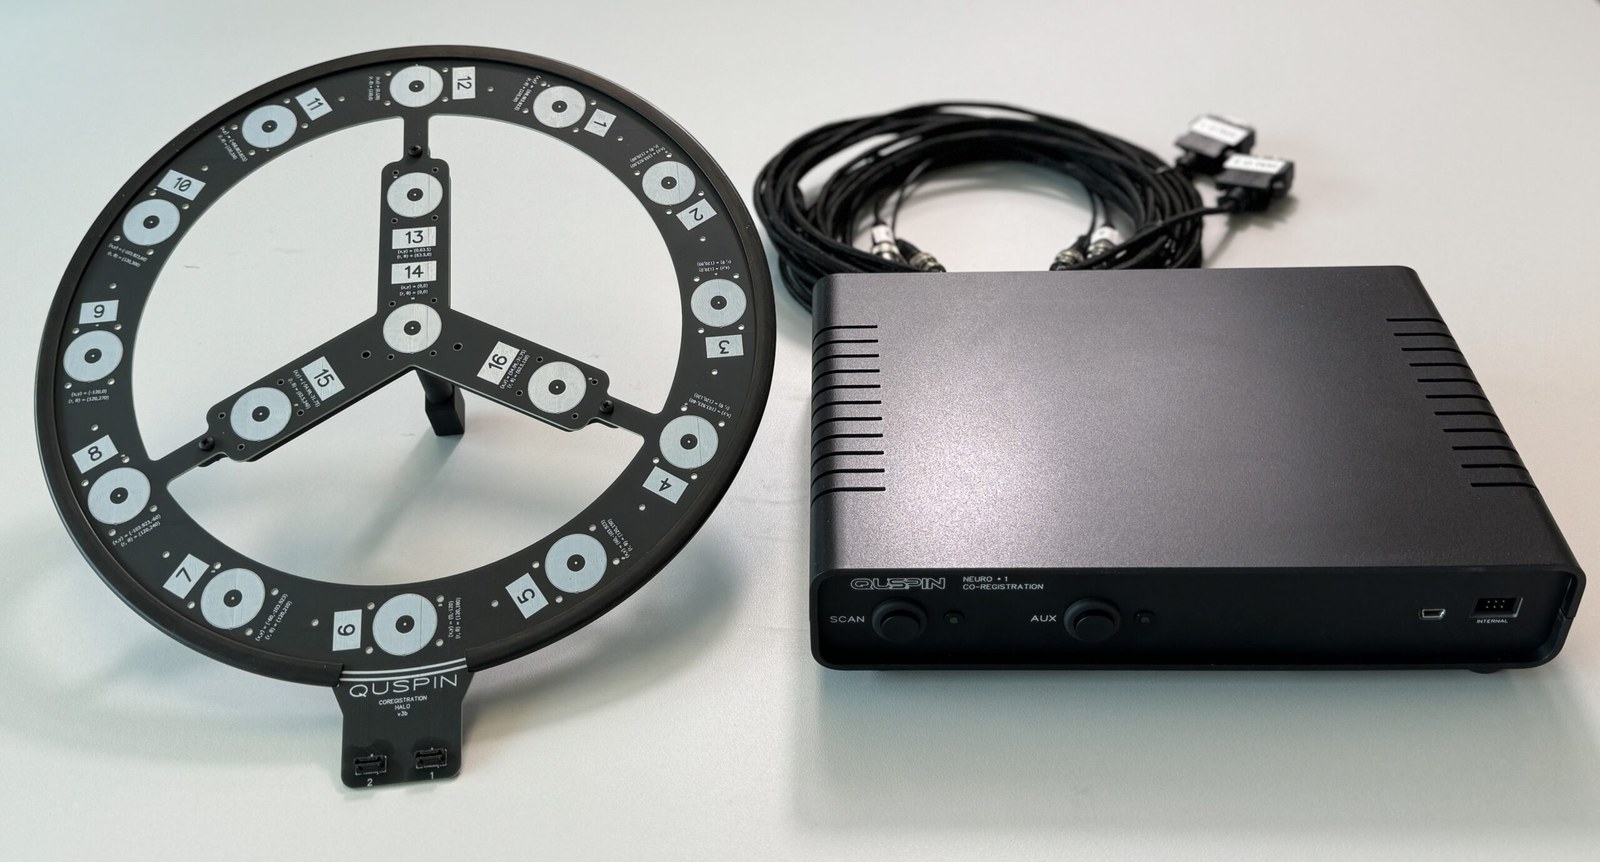
Clipped over the sensor vest, the HALO fires its 16 coils, each producing a known magnetic field — and every sensor in the grid beneath detects every pulse.
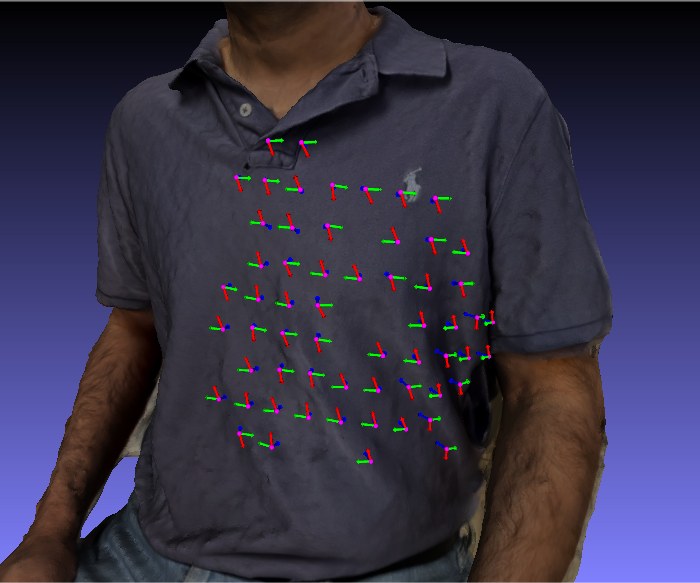
The localization algorithm analyzes each sensor’s recorded response to those pulses, solving for its position and orientation on the subject’s 3D photogrammetry model.
With the vest populated with 64 triaxial sensors — 192 measurement channels, one per axis — the volunteer sat at rest in a magnetically shielded room while the array recorded for several minutes. A 1 Hz high-pass filter removes slow baseline drift, a 60 Hz notch removes power-line interference, and the heartbeat is then clearly visible in the data.
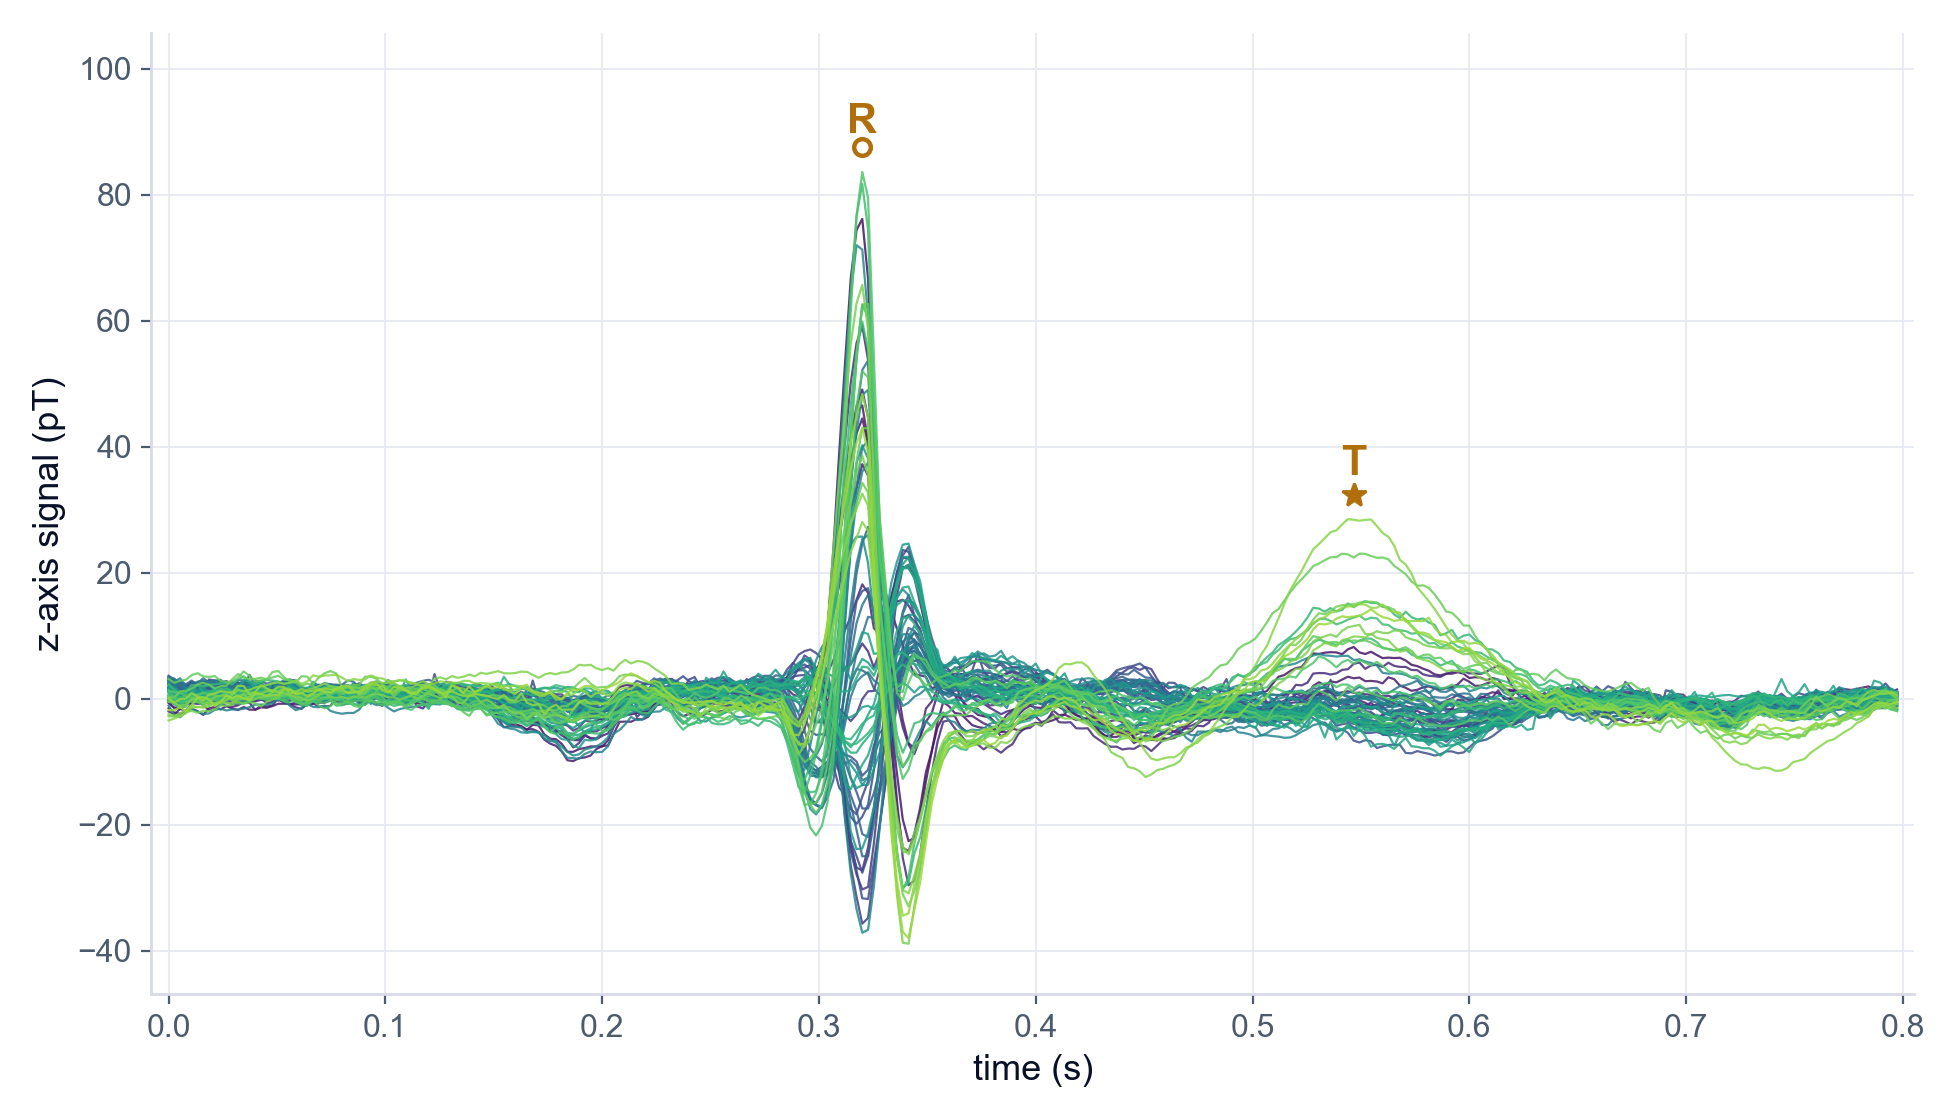
This overlay is called a butterfly plot, and it is the standard first look at array data. Every line is one sensor’s view of the same heartbeat — here the field component perpendicular to the chest. All traces spike together at the R-wave, but with amplitudes and signs that differ from sensor to sensor: the field is strong and positive over one part of the chest, strong and negative over another. That sensor-to-sensor variation carries the spatial information a single-channel measurement cannot provide, and it is what the field maps in the next section are built from.
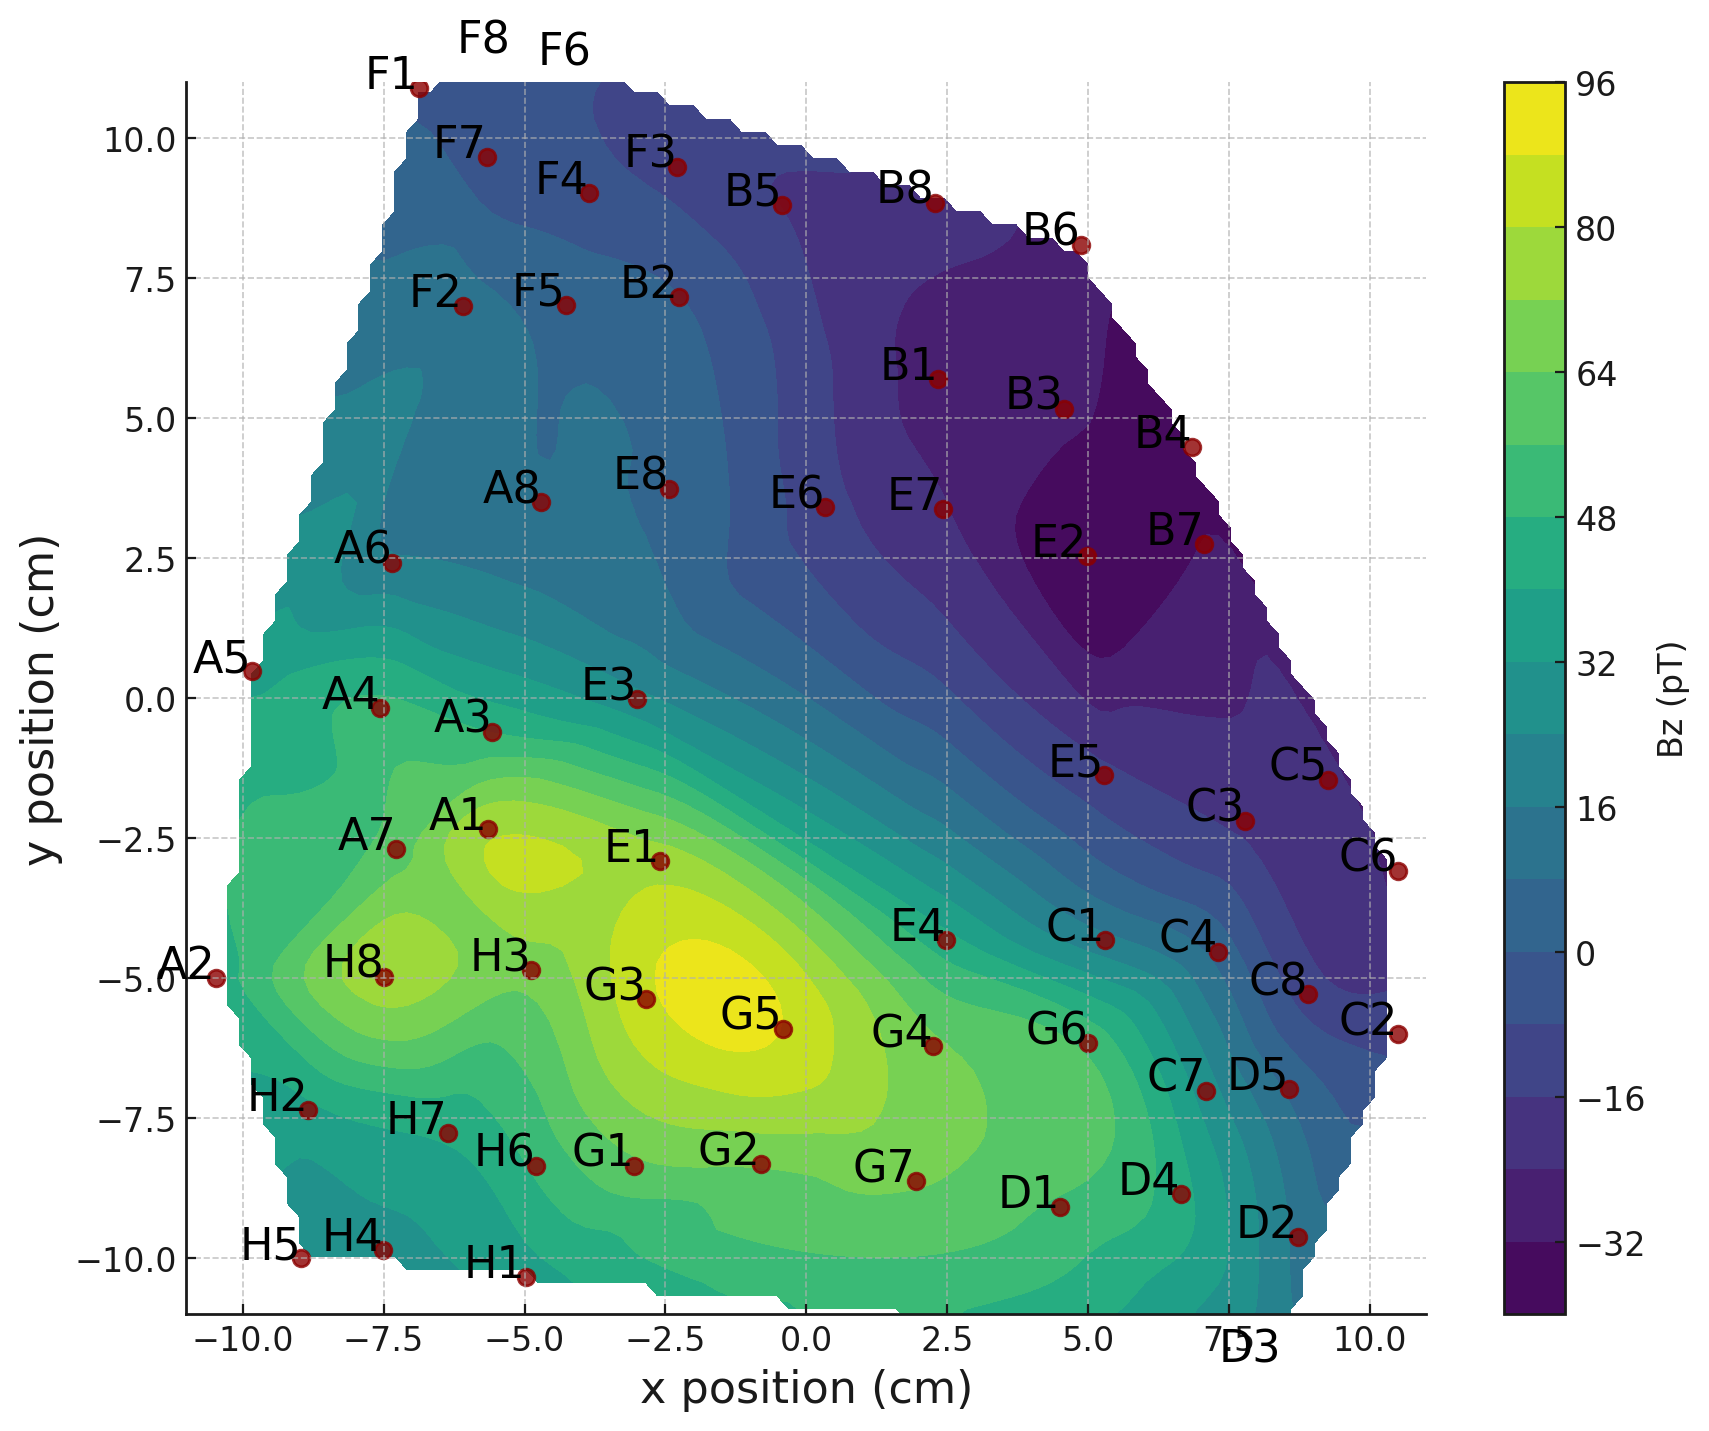
A field map is made by taking each sensor’s reading at one instant and plotting it at that sensor’s co-registered position on the chest. Interpolating between the sensors gives a picture of the heart’s magnetic field at that moment.
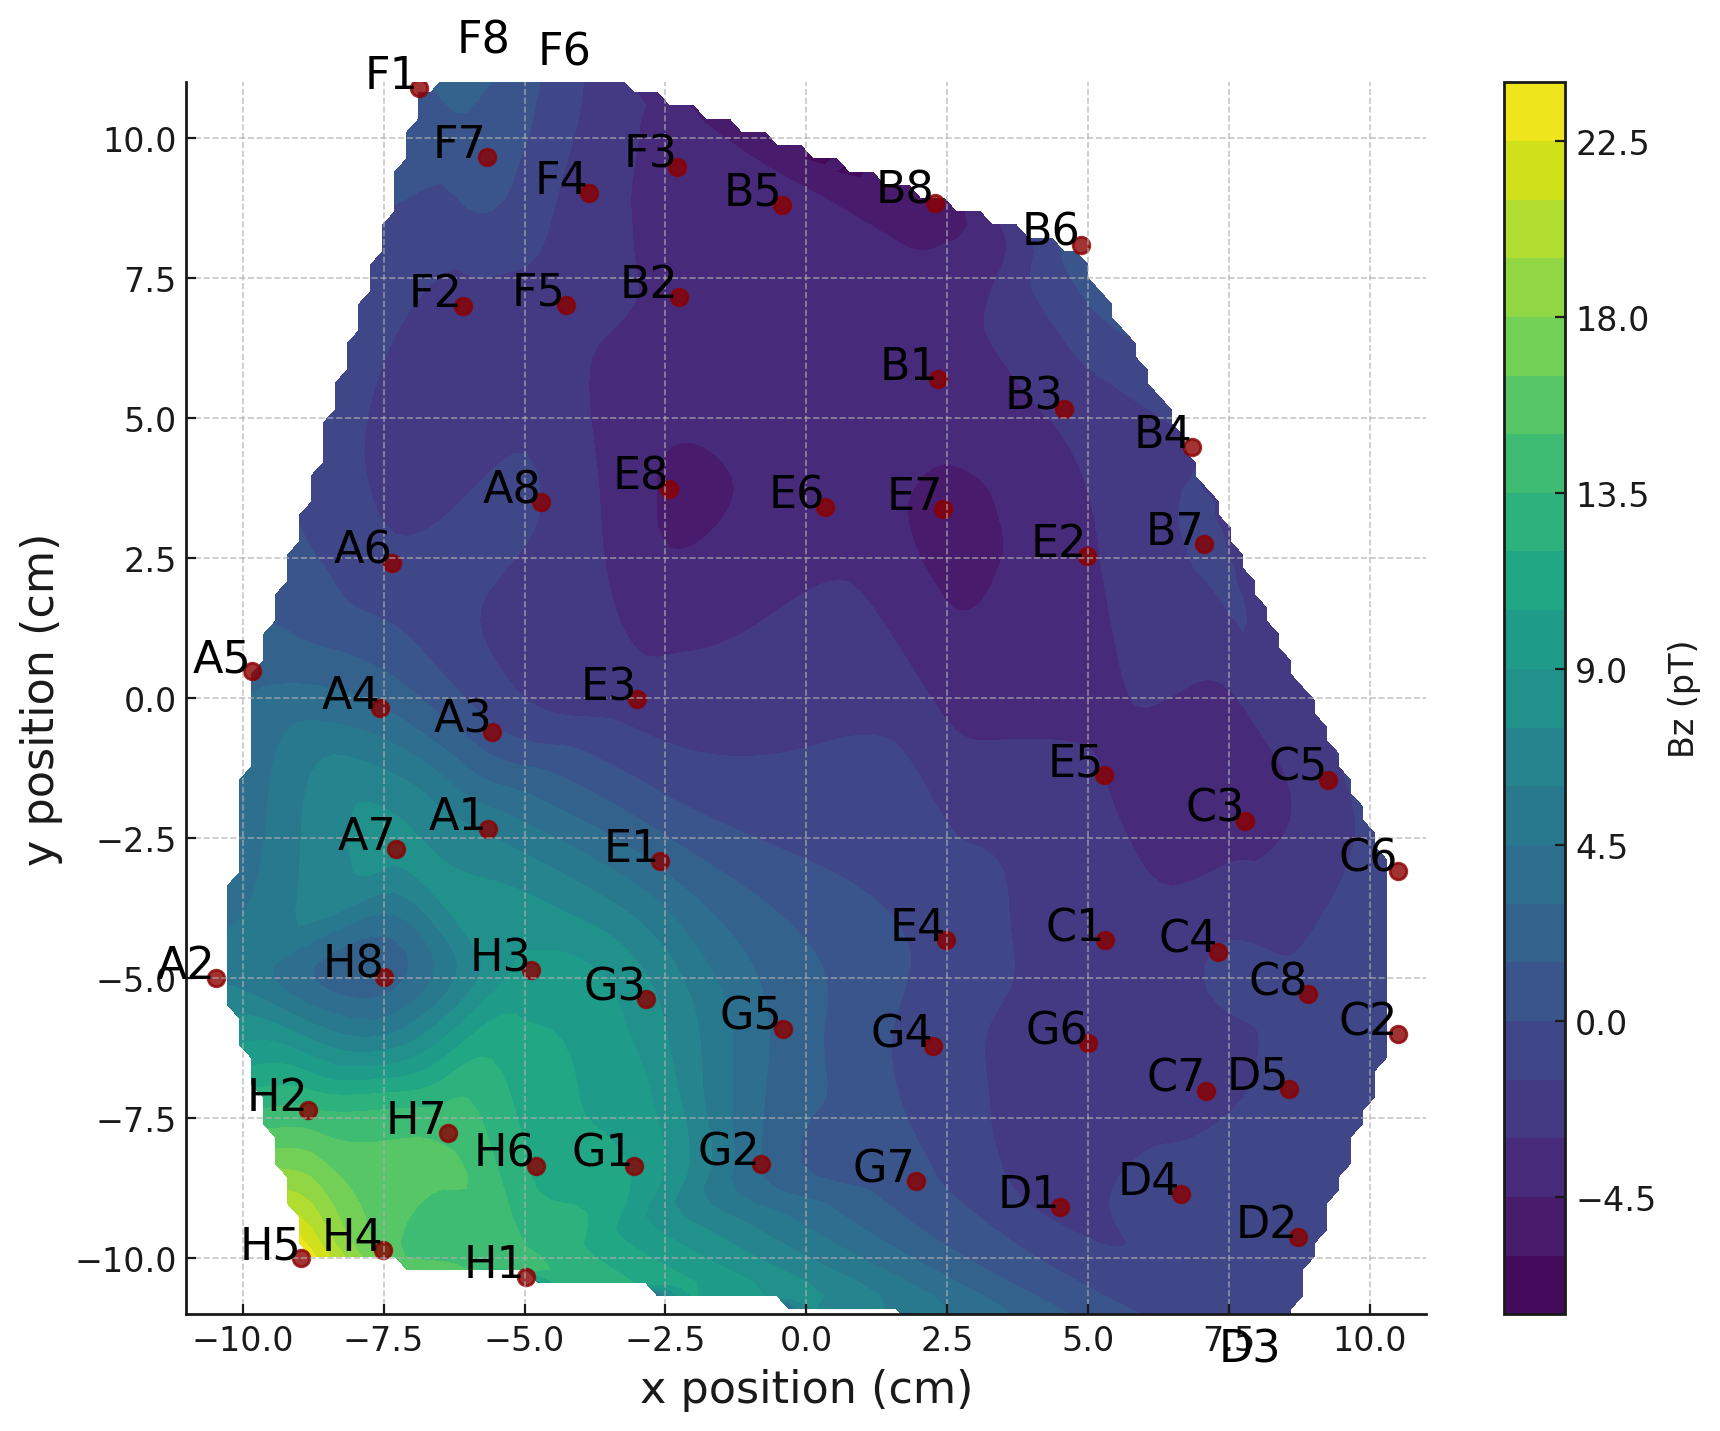
The R-wave map shows the coherent, dipole-like pattern expected from the organized wave of depolarization: a bright positive region where field lines emerge from the chest, falling away smoothly into the negative region where they return. The T-wave map is roughly four times weaker and more diffuse, consistent with the physiology of repolarization, which involves gentler current flow than the contraction itself. Both patterns agree with what the MCG literature reports for healthy hearts.
The red dots and labels mark the sensors themselves, at the positions solved by the HALO rather than at nominal grid coordinates. Because of that co-registration step, the maps are drawn in the subject’s own frame of reference and can be laid directly over an anatomical image.
The butterfly plot and the field maps show the same data in two forms, one as a function of time and one of position. The animation below combines them: it replays five consecutive heartbeats from the study recording, with a marker following the strongest channel through the traces while the field map, and the same field projected onto the subject’s 3D scan, update in sync. Press play, or drag the slider to move through the recording.
Loading the recording…
The animation uses real data from the study recording: 63 z-axis channels over five consecutive beats, 1 Hz high-pass and 60 Hz notch filtered, on a fixed color scale. The patient view projects the same field onto the subject’s photogrammetry model at the HALO-registered sensor positions; the flat-plane fit is approximate toward the edges of the chest.
Because magnetic fields leave the body without distortion, the field pattern over the chest carries information about where inside the heart the underlying currents flow. With accurately localized sensors and an anatomical scan of the same person, inverse modeling can estimate those current sources. That is the goal of cardiac electrophysiology imaging.
One clinical motivation is arrhythmia treatment. Ablation requires finding the small region of tissue where the abnormal rhythm originates, which today involves threading catheters into the heart to map it from the inside. A wearable, contactless measurement that helps localize such sources from outside the body could reduce the time and invasiveness of that mapping.
This study covers the first part of that path. It shows that a conformable OPM array, co-registered with the HALO, can record cardiac field maps from a single heartbeat with hardware light enough to wear.
Single-beat field maps from an array worn on the body, with every sensor position solved to millimeters.
The measurements shown here come from a single-subject proof-of-concept study on a healthy adult volunteer, using research hardware. They illustrate feasibility and are not diagnostic results; QuSpin’s MCG instrumentation is research equipment and is not a medical device.