This is the previous version of the QZFM Quick Start Guide, retained for reference. For current instructions see the QZFM Quick Start Guide.
Introduction
This guide will provide information on how to quickly setup and operate the QZFMs.
What’s in the box?
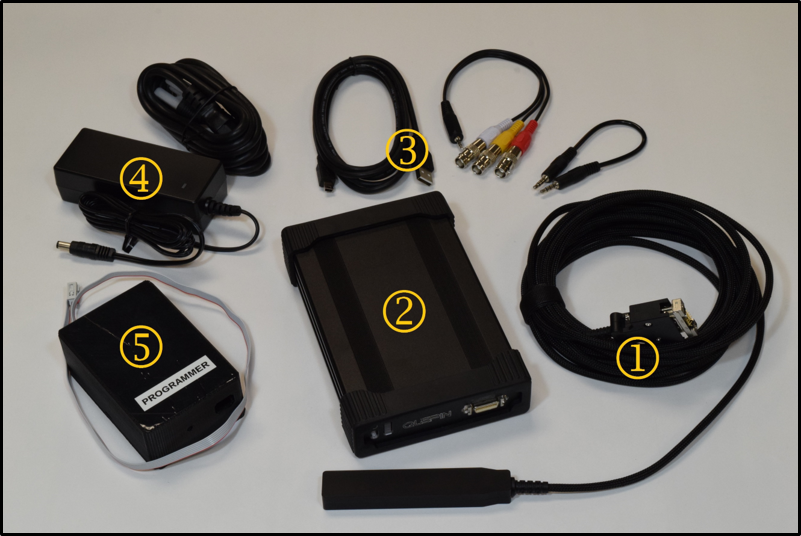
The QZFM package includes these components that are necessary to operate a sensor (Figure 1):
- Sensor head with 20 ft. cable and a laser shorting cap attached at connector end
- Electronics Module
- 5 mm modulation audio cable, 2.5 mm audio to 3-way BNC cable, and USB cable
- Power supply (1 unit for every 4 sensors) and power splitter cable
- Programmer unit for updating sensor firmware *(not applicable to some electronic versions)
Hardware Setup Procedure
Step 1
Carefully remove the sensor(s), electronics module(s), and all cables from the box. Pair each sensor to its matching electronics module with the same serial number (SN located on both ends of the sensor as well as on the front and/or side of the electronics module).
Step 2
Remove the laser shorting cap(s) from the sensor(s) cable connector using a Philips head screwdriver and immediately attach the sensor connector to the electronics jack ③ in Figure 2, and secure the screws.
The sensor is highly sensitive to ESD, so please take precautions to avoid shocks while connecting the sensor(s).
Step 3
Make sure the power switch ① on all electronics modules is OFF (down position) then connect the power supply to “19 V DC” ⑩.
Step 4
Connect the USB cable for each sensor, with the mini connector to the “Digital Out” port ⑧ on the electronics module and the type A connector to the computer, either directly or through a USB hub.

Step 5
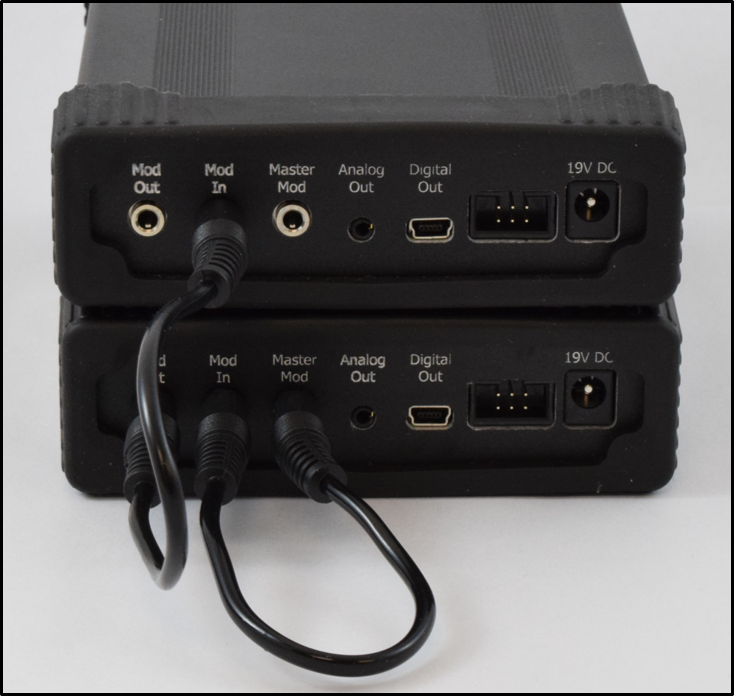
For multi-channel configurations, the modulation signal must be shared. Connect the modulation cables in the following configuration: For the Master electronics module, connect “Master Mod” to “Mod In”. Then connect the “Mod Out” from the Master, to the “Mod In” of a Slave electronics module. This can be continued by connecting the “Mod Out” of that Slave to the “Mod In” of the next Slave, repeating until all electronics modules are receiving the Master modulation (shown in Figure 3).
Step 6
For external data acquisition or signal monitoring, the audio to BNC cable can be connected to the “Analog Out” ⑦ of the electronics module to provide BNC connectivity to an external device, such as an oscilloscope or DAQ, to observe the analog output. The red connector is for the Z-axis signal, the white connector is for the Y-axis signal, the yellow connector is not used.
Software Setup Procedure
Step 1
The QZFM User Interface (UI) uses the LabVIEW platform, which requires VISA drivers and the runtime engine on a 64bit computer with Windows 7 or later. Download and install the two application files LVRTE2014f2_64bitstd.exe and NIVISA1501full.exe. Please follow the standard installation instructions.
Step 2
Download and run the
QZFM Setup (R1.2).exe
application to generate the ‘MagSetup.ini’ file, which is necessary for the QZFM UI
to communicate with the sensor(s). The video titled Tutorial for
QuSpin ZFM Setup.mp4
demonstrates this procedure for setting up the sensors. Note: the UI may be
updated and look visually different from the tutorial video, however, functionality is very
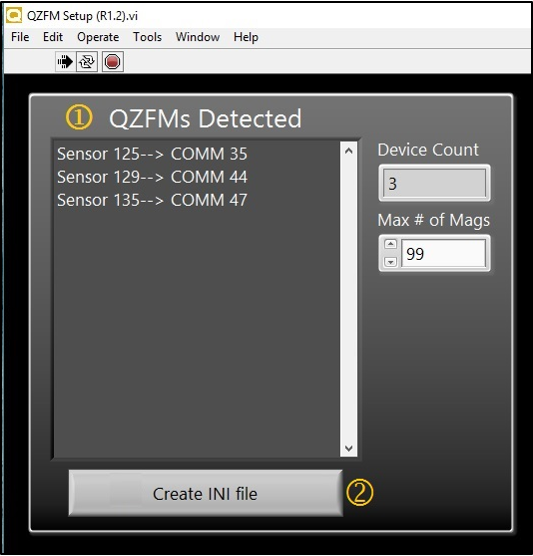
similar. When the QZFM Setup application is opened, all connected sensors should appear in the
“QZFMs Detected” list within a few seconds. Verify that all sensors are displayed
in the List box ① in Figure 4, then click the [Create INI file] button
②. Then wait until the program stops running (arrow on the upper left
side of the window turns from black to a gray color in less than 10 seconds), indicating that
the MagSetup.ini file has been generated (in the same directory). This step ONLY
needs to be repeated (a new ‘MagSetup.ini’ file generated), if sensors are added or
removed from the system.
Step 3
Finally, download and run the file QZFM 8-Channel UI (R3.1).exe to operate the sensors.
Operating the Sensors
Once the QZFM UI is running, all sensor IDs (serial numbers) should appear within a few seconds in the column on the right under the “M#” label, ① in Figure 5. Next, switch ON (up position) and power the electronics module(s). Observe that all four LEDs on the front of the module or in the UI flash green/amber three times to indicate successful bootup. The “Sensor Status” field ② should display a “Ready” when bootup is complete. Now, press the [Auto Start] Button ③ to bring the sensors online. The startup process takes a few minutes and is complete when the first three LEDs are green. The Laser On/Off LED will turn green to indicate that the laser is on. Then the Laser Lock LED will turn green when the laser frequency is locked. Finally, the Cell T Lock LED will turn green when the vapor cell is at optimal temperature.
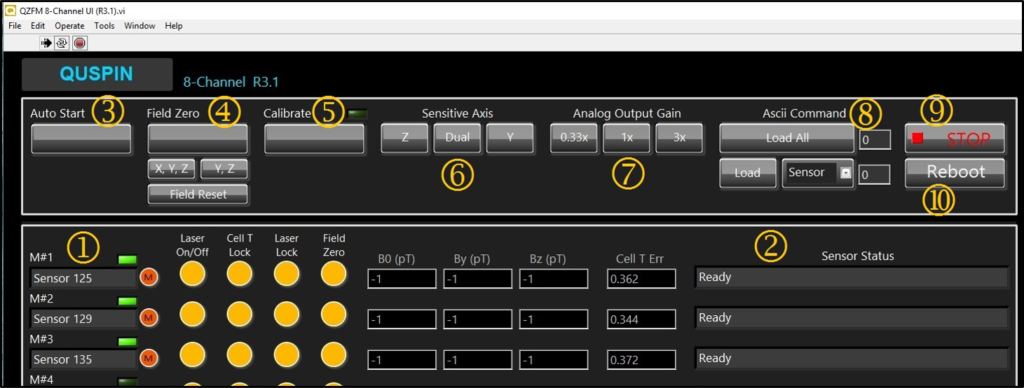
Once the first three LEDs are green, press the [Field Zero] button ④ once to activate field zeroing. The button will turn amber color while active. When the field values for B0, By, and Bz (in units of pT) stop fluctuating (to within a few 100 pT, usually taking between 3–10 seconds) press the [Field Zero] button a second time to stop the process and lock the compensation fields and the forth LED turns green.
It will be necessary to repeat [Field Zero] operation every time the “Sensitive Axis” is switched to a different mode or the background field is expected to have changed significantly (e.g. opening and closing the shields, or moving the sensors).
When all 4 LEDs are green, press the [Calibrate] button ⑤. Wait for calibration values to appear sequentially in each corresponding “Sensor Status” box (this process takes a few seconds per sensor). Calibration values less than 1.5 are considered normal and indicate optimal performance. Calibration values above 1.5 indicate sub-optimal sensor performance, either due to large background field (> 50 nT), or a possible sensor issue.
The “Sensitive Axis” buttons [Z], [Dual], and [Y] will switch between the axis modes. The default mode is single Z-axis. When switching between measurement axes, it is necessary to run the [Field Zero] operation followed by [Calibrate].
To stop the program, it is important to first press the UI [STOP] button in the top right of the window, instead of terminating the LabVIEW application by closing the window or pressing the standard small red stop button in the top left. This allows the program to properly relinquish the sensor COMM ports.
The [Reboot] button resets all electronics (similar to power cycling) and reloads the firmware defaults.
Data Save
The QZFM UI provides data saving functionality through the digital output (at 200 Hz sampling
rate). Simply set the folder path for the data files in the “File Path (Folder)”
field, ① in Figure 6. Any comments typed in the “Comments”
field ② (before or during data recording) will be saved along with the
data in a separate file with the added file name extension _comment.txt. To save
data, press the [File Save] button ③ once to activate data recording
(highlighted in red while active). Pressing the [File Save] button a second time stops data
recording and generates a .lvm data file for each sensor (and the associated comment file) in
the selected folder.

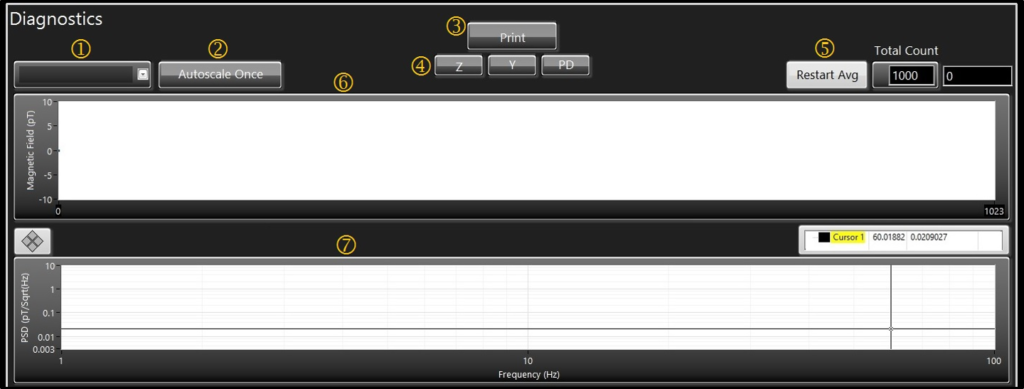
Diagnostics
The drop-down bar ① in Figure 7 allows the user to select a sensor and display its output in the time series chart ⑥ and frequency spectrum graph ⑦. Press the [Print] button ③ (highlighted in amber while active) to start displaying the digital output of the selected sensor. Note: while the [Print] function is active, other sensor indicators such as the LEDs, will not update. Press [Autoscale Once] ② to scale the Y-axis of the chart when needed. The [Z], [Y], and [PD] buttons ④ allow for selecting the displayed output of the Z axis, Y axis, or photodiode respectively. The [Restart Avg] button ⑤ will clear and restart the averaging for the spectral graph ⑦.